Summer 2011 (June 6 – July 31)
PICTURE OF THE SEASON: |
|
|
| MAPS SEASON | 2011 TOTAL | SITE TOTAL | |
|---|---|---|---|
| # birds (and species) banded | 111 (21) | 1088 (66) | 32659 (107) |
| # birds (and species) repeat | 17 (7) | 155 (25) | 5662 (68) |
| # birds (and species) return | 9 (6) | 95 (18) | 902 (37) |
| # species observed | 60 | 140 | 202 |
| # net hours | 378.0 | 2837.0 | 52454.1 |
| # birds banded / 100 net hours | 29.4 | 38.4 | 62.3 |
Note: table does not include nocturnal banding (owls)
Banders-in-charge: Simon Duval, Gay Gruner
Assistants: Jean Demers, Mary Robichaud, Clémence Soulard, Matthew Von Bornhoft
Monitoring Avian Productivity and Survivorship (MAPS), Summer 2011
The MAPS program is a breeding-season study. Banding takes place on a single day during each of seven consecutive ten-day periods between June 6 and July 31. The first five periods coincide with the “adult superperiod” and the last two with the “young superperiod”. Following a general pattern, adults usually predominate in the catch during the “adult superperiod”, while young birds predominate during the “young superperiod”. We do not use our 16 migration-monitoring net locations; rather we use nine nets placed around the southern end of Stoneycroft Pond. In addition to operating mist nets, observers gather breeding bird evidence on all species heard or seen during each banding day.
|
|
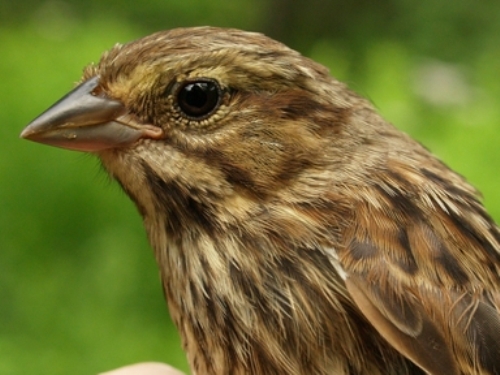
This year we banded 111 individuals, down from last year’s total of 125 and slightly higher than the 2009 total of 105. As in both previous years, the majority of birds were banded in the last three sessions including the “young superperiod”, an indication that the captured species had a successful breeding season.
| # individuals banded [rank in 2010] | mean # individuals observed |
|---|---|
| Song Sparrow (18) [1] | 1. Red-winged Blackbird (14) |
| 2. American Robin (14) [3] | 2. Black-capped Chickadee (9) |
| 3. Red-eyed Vireo (12) [5] | 2. Cedar Waxwing (9) |
| 4. Yellow Warbler (11) [6] | 4. American Robin (8) |
| 5. Baltimore Oriole (9) [7] | 5. American Crow (7) |
| 6. Black-capped Chickadee (8) [2] | 5. Song Sparrow (7) |
| 7. Downy Woodpecker (6) [7] | 5. American Goldfinch (7) |
| 7. Gray Catbird (6) [-] | 8. Yellow Warbler (6) |
| 9. House Wren (3) [-] | 9.Common Grackle (5) |
| 9. Black-and-white Warbler (3) [-] | 10. Tree Swallow (4) |
| 9. Common Yellowthroat (3) [-] | |
| 9. Swamp Sparrow (3) [10] |
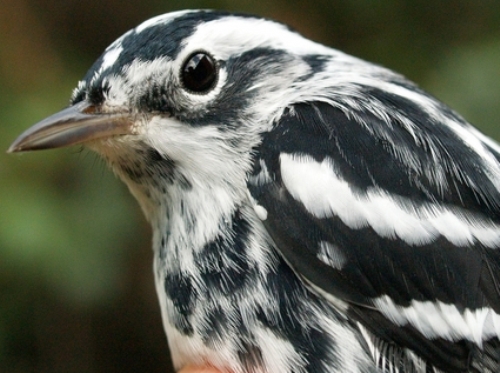
Seven of the ten most frequently banded species this year were also in the top ten lists of 2009 and 2010, although positions shuffled slightly: Song Sparrow, American Robin, Red-eyed Vireo, Yellow Warbler, Baltimore Oriole, Black-capped Chickadee and Downy Woodpecker. Although they have always been present each season, the following three species achieved top-ten status for the first time this year: House Wren, Common Yellowthroat and Black-and-white Warbler.
Rose-breasted Grosbeaks were observed during the season, yet were absent from the ranks of the top-ten banded; this year we struck out and did not band a single individual of this species. Another noteworthy absence from the top ten is Cedar Waxwing. This species has ranked fifth (2009) and fourth place (2010) in the previous top ten lists for the MAPS program. Surprisingly, we only banded two individuals despite observing them during each session.
Eleven species were observed onsite each session: Red-eyed Vireo, American Crow, House Wren, American Robin, Cedar Waxwing, Yellow Warbler, Common Yellowthroat, Northern Cardinal, Song Sparrow, Swamp Sparrow and American Goldfinch. Five species were observed six out of seven sessions: Red-shouldered Hawk, Blue Jay, Common Raven, Gray Catbird and Red-winged Blackbird. The drudgery of dodging mosquitoes was enlivened by our observations of Common Raven. The Ecomuseum, our immediate neighbour to the south, houses a captive Common Raven which receives regular visits from local at-liberty Common Ravens. We regularly observed raven fly-bys, and one day we were awed by the sight of a spunky Eastern Kingbird chasing a Common Raven that had flown too close to the kingbird’s nest! The Common Raven does not breed onsite, but it must nest in the vicinity.
MAPS is not a glamorous program; the capture rate is low, the heat is fatiguing and the assault of insatiable mosquitoes is relentless. However, the data from MAPS are used to create profiles of vital rates (i.e., reproduction and survival) of birds as well as note differences in vital rates between populations or regions and changes in vital rates over time. Trend data from the North American Breeding Bird Survey suggest that some populations of migratory songbirds are declining. How do we make the leap from being aware of the decline to making effective management decisions to reverse these declines? The MAPS program has two major objectives: to determine the cause of population declines; and to devise habitat management actions and conservation strategies to reverse such declines. To make wise choices about managing our environment, we need to better understand the life cycle and behaviour of our birds and MAPS provides the data from which we learn.
We are extremely grateful to our MBO volunteers at all times, but those who help with the MAPS program deserve special mention: Jean Demers, Mary Robichaud, Clémence Soulard and Matthew Von Bornhoft – thank you!!
|
|
 Again this summer we banded more Song Sparrows during the MAPS program than any other species, including this very dark juvenile already flying around in late June. (Photo by Simon Duval)
 A three-year comparison of the number of individuals banded per session during the MBO MAPS season, showing a remarkable consistency between 2009 and 2011 in particular.
  Although we had occasional sightings of Black-and-white Warblers at MBO during summer annually from 2005 to 2007, they were absent in June and July for the next three years, and this year marked the first time that we banded any during summer. (Photos by Simon Duval)